...
Statistics: changes in terms of application filings and grants with respect to previous year; trends or areas experiencing rapid changes
Inventions
Data relating to the filing of applications and the grant of Russian Federation invention patents for 2015-2016 are presented in Table 1.
Table 1
| 2015 | 2016 | % 2016/2015 |
Total number of invention applications filed, including: | 45517 | 41587 | 91,37 |
- by Russian applicants | 29269 | 26795 | 91,55 |
- by foreign applicants | 16248 | 14792 | 91,04 |
Total number of patents granted, including: | 34706 | 33536 | 96,63 |
- to Russian applicants | 22560 | 21020 | 93,17 |
- to foreign applicants | 12146 | 12516 | 103,05 |
From Table 1, above, it can be seen that 2015 saw decline in both the number of applications filed (8.63%), and in invention patents granted (3.37%) in comparison to 2015.
The invention patents granted in 2016 were distributed according to the IPC sections as follows:
Table 2
IPC Section | Invention patents | ||
| Russian | Foreign | Total |
A | 4845 | 2499 | 7344 |
B | 2361 | 2328 | 4689 |
C | 5778 | 2116 | 7894 |
D | 63 | 190 | 253 |
E | 1344 | 581 | 1925 |
F | 2128 | 1306 | 3434 |
G | 3039 | 1746 | 4785 |
H | 1462 | 1750 | 3212 |
Total | 21020 | 12516 | 33536 |
The largest number of patents for inventions granted in 2016 was to Russian applicants for Section С of the International Patent Classification (IPC) – CHEMISTRY; METALLURGY; this year, this section was the most popular for Russian applicants; as for foreign applicants the most popular section was Section A - HUMAN NECESSITIES .
The least popular Section among Russian and foreign applicants alike remains Section D – Textiles and Paper. The number of patents granted for this Section in 2016 comprised only 0.75 per cent of the overall number of patents granted for inventions.
Utility models
Тable 3
| 2015 | 2016 | % 2016/2015 |
Total number of utility-model applications filed, including: | 11906 | 11112 | 93,33 |
- by Russian applicants | 11403 | 10643 | 93,34 |
- by foreign applicants | 503 | 469 | 93,24 |
Total number of patents granted, including: | 9008 | 8875 | 98,52 |
- to Russian applicants | 8390 | 8474 | 101,00 |
- to foreign applicants | 618 | 401 | 64,89 |
In 2016, the number of applications received for utility models fell. The number of applications received decreased by 6.67 per cent, and this decline was seen both in applications filed by domestic applicants (6.66 per cent), and, by foreigners (6.76 per cent). The total number of patents granted likewise declined, by 1.48 per cent.
Data on the distribution of patents for utility models by IPC Section are presented below.
Тable 4
IPC Section | 2015 | 2016 |
A | 1579 | 1550 |
B | 2021 | 2034 |
C | 269 | 194 |
D | 42 | 36 |
E | 1192 | 1184 |
F | 1557 | 1487 |
G | 1376 | 1343 |
H | 972 | 1047 |
Total | 9008 | 8875 |
The leading IPC Section in 2016 remained Section B – Performing Operations and Transporting – while second place was taken by Section A – Human Necessities. As in 2015, Section D – Textiles and Paper – continued to be the least in demand, with the lowest number of certificates granted.
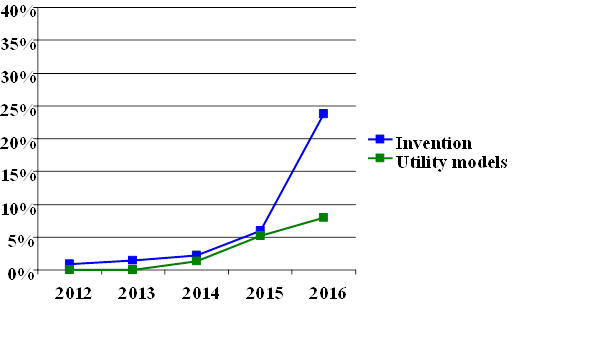
Over 10,000 applications for inventions and utility models were filed electronically during 2016; for inventions- 9,873 (over 23 per cent of the total number of invention applications), and for utility models- 880 (approximately 8 per cent of the total number of utility-model applications).
In order to conduct correspondence electronically on applications for inventions and utility models filed is done through the Personal Office service of the FIPS website.
The growth in electronic filing of applications for inventions and utility models is presented in the diagram below:
Other matters and useful links (URLs): annual report of the Office, news page, statistics, etc.
...